
You think this time will be different?
A very bullish set up

A month ago I posted about my recent buys and one of them was Sugar.
You can read it here.
When you like my content and the knowledge I share here, I appreciate it when you subscribe to my substack account. You can do it here.
Part 1 - The 200 day moving average
There are dozens of technical indicators available to the modern investor, but few have earned as much respect across asset classes and time horizons as the 200-day moving average (200-DMA). It is, in its simplest form, just the average closing price of an asset over the past 200 trading days, roughly ten months of market history distilled into a single line.
What makes it powerful is not the math, but the psychology. Because so many institutional and retail investors watch this level simultaneously, it tends to become a self-fulfilling reference point. Markets repeatedly find support when they fall toward it in an uptrend, and resistance when they rally back toward it in a downtrend. Cross it convincingly, and a regime change often follows.
Part 2 - The Macro Thesis: Oil, Food & Sugar
Most people don’t think of oil when they buy sugar. But the link between energy prices and food costs is one of the most powerful and underappreciated dynamics in global commodity markets. In my opinion, high oil prices will result in higher agricultural prices.
The mechanism is threefold. First, energy is embedded in every stage of food production: fuel for machinery and transport, natural gas for fertiliser manufacturing, and electricity for cold storage and processing. When oil rises, these input costs rise with it, pushing up the cost of producing virtually every food commodity.
Second, shipping costs are sensitive to fuel prices. A large portion of the world’s sugar, wheat, and vegetable oils travel thousands of miles by sea before reaching consumers. Elevated freight rates act as a hidden tax on imported food — one that is especially punishing for emerging markets that depend on food imports.
Part 3 - My current view on Sugar
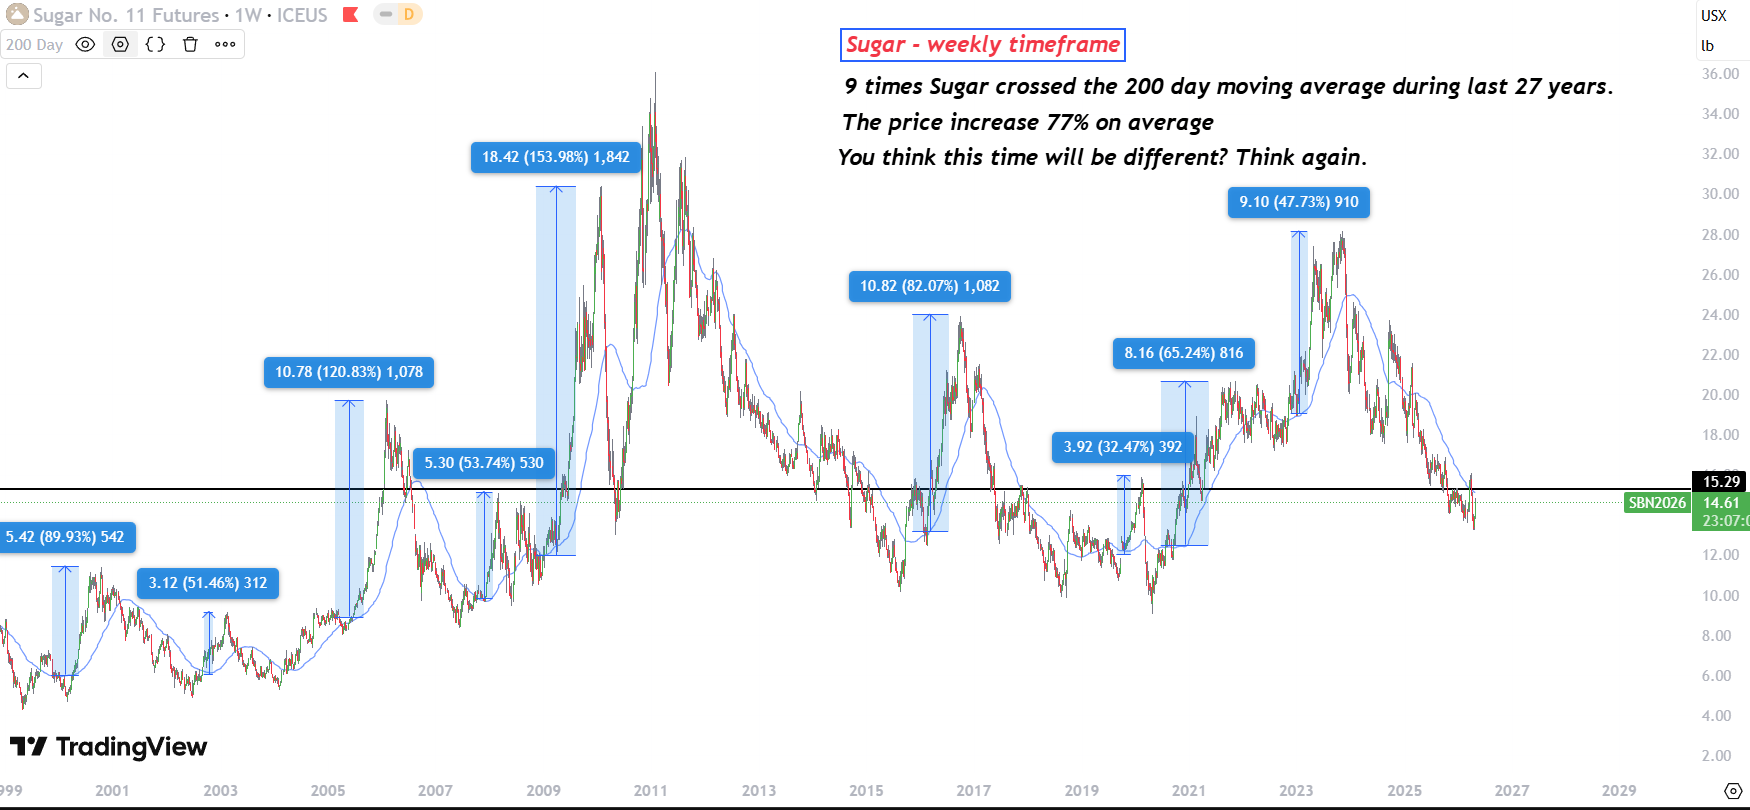
In the cart below I painted my current view on Sugar.
I focused on the historical moments when Sugar crossed above the 200 day moving average, after some downwards price action.
The 9 times I plotted in the chart, I see an average of 77% price increase.
Currently the 200 day moving average on Sugar sits at 15,11.
So the current price is approaching the 200 day moving average.
Conclusion
The current fundamental thesis with the big price moves in oil and the correlation with the food prices, combined with the price action and the price sitting around the 200 day moving average, I expect a price move when it crosses this.
Important note: This could not be considered as investment advice and is my own investment view.
I don’t understand. What do you mean sugar crossed the 200 DMA? I understand the 200 DMA. Could you elaborate on what is in the chart? I think I was expecting a 200 DMA for oil and then one for sugar with the latter effectively a lateral shift right of the former, more or less mirroring it. Think of two graphs of the motion of the front and rear wheels of a car crossing a sped bump — because they are obviously linked the front will see a rise on its graph followed milliseconds later by a bump in the back wheels’ graph. Hope that makes sense.